Flourish data visualisations
Flourish is an online data visualisation platform that allows users to create visualisations such as charts and graphs. The Drupal CMS supports Flourish visualisations to be uploaded to the media library so the charts and graphs can be added to pages.
About Flourish
Flourish offers a range of free templates and tools, from the simple to the complex, that enable users to create visualisations such as charts, graphs, maps and animations.
Flourish provides a simple interface where users can upload their data and customise the visualisation with various options such as colour, size, and font. The platform also supports real-time data updates, for displaying dynamic or live data.
Flourish visualisation templates
There are many templates available for different types of data visualisations, including charts, maps and diagrams.
Find out more about Flourish templates
Create a new visualisation
- Sign into your Flourish account.
- Click on New visualisation in the top toolbar.
- The template menu is now available.
- Choose a template. One option could be to select a Bar chart.
- The Bar chart template is now available to edit.
- Give the Bar chart a title in the Untitled visualisation field.
- In the side menu, select Chart type as Bar chart (grouped).
Add data and customise the visualisation
For this example, the template bar chart will be edited to this display.
Edit the data tab
- Click on the Data tab. The data interface looks and behaves like an Excel sheet where you can insert rows or columns, remove rows and columns and edit the data cells.
- Enter or copy and paste your data into the data tab of the visualisation editor. Your data should be formatted in a table, with columns for categories and values.
- Any updates to the data will be instantly reflected in the visualisation.
- Remove any columns and rows that are not required for your chart.
- Switch to the Preview tab to see how your bar chart will look when it's published.
Customise the visualisation
There many options available in Flourish to customise your visualisation.
Generally the default settings when you create a project will be suitable for most visualisations.
There are some settings you may wish to customise depending on the data you are presenting.
| Item | Description |
|---|---|
| Colours | You can choose a Flourish system colour palette for the visualisation. There is the option to edit an exisiting colour palette or to apply custom overrides and set your own colour display. |
| Bars | Adjust the bar height, opacity and spacing of the bars in the chart. |
| Labels | Choose if the labels display above the bars or on the axis. Set the label size and whether you want the labels on the data points. Adjust the label text colour and size. |
| X axis | Option to position or hide the x axis labels and set an axis range. If you are working with % data, set the min to '0' and max to '100'. |
| Y axis | Option to hide or display the axis labels and to change the label position and style. |
| Number and date formatting | Choose a number style and set the number of decimal points. Add a prefix or suffix to the number, for example, %. |
| Legend | Option to show, hide or align the data table legend. |
| Popups and panels | Option to have a popup of the data when hovering over the bars. |
| Animations | Option to animate the bars on the chart upon load. |
| Header | Add a header to the bar chart. |
| Footer | Add a footer to the bar chart to include the data source. |
| Accessibility | For accessibility it is important to include a text version of the graph data. |
Publish the visualisation
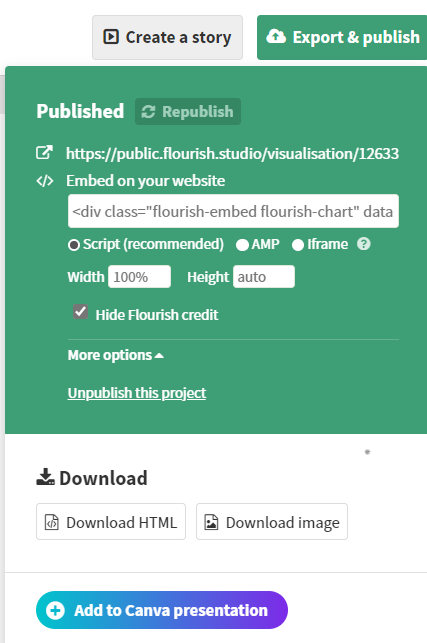
- You can publish your project on Flourish by clicking on the green Export & publish button located in the top right corner.
- A green pop-up box will appear giving you options to publish your project on Drupal via:
- a URL which contains an 8-digit ID code
- an embed link
- downloading HTML
- downloading an image.
Use visualisation on other platforms
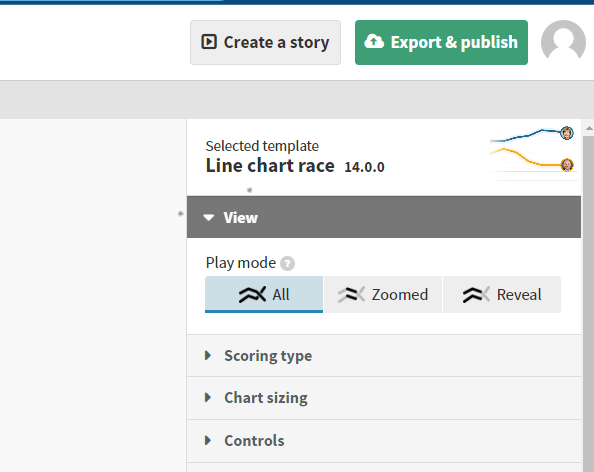
- You will also be given options to:
- select: Script, AMP, Iframe
- alter Width and Height
- add to a Canva presentation.
Additional changes
- You can make changes to your project and republish once embedded on Drupal. Just select: Republish.
- You can also unpublish your project. Just select: Unpublish this project.
Upload the Flourish chart to Drupal
- Once the visualisation is published in Flourish, cut and paste the URL to notepad.
- <div class="flourish-embed flourish-chart" data-src="visualisation/13623881"><script src="https://public.flourish.studio/resources/embed.js"></script></div>
- Within the URL find the 8-digit Flourish ID, for example, 13623881.
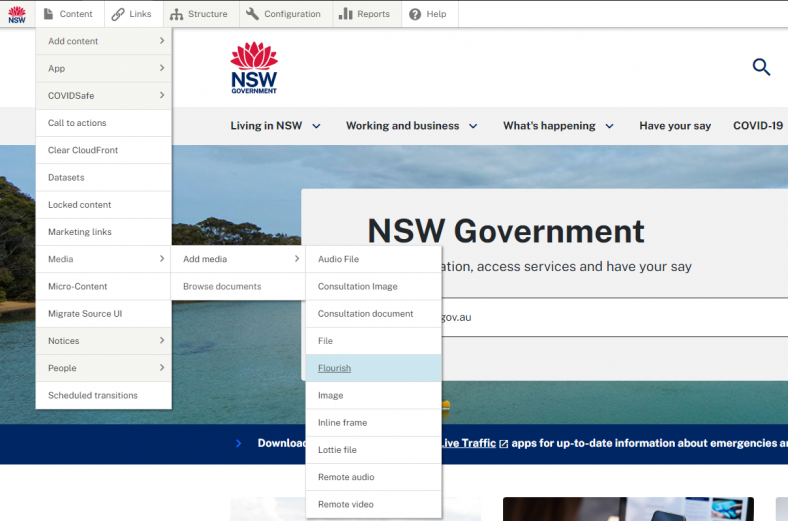
- Open Drupal and follow this path: Content > Media > Add media > Flourish.
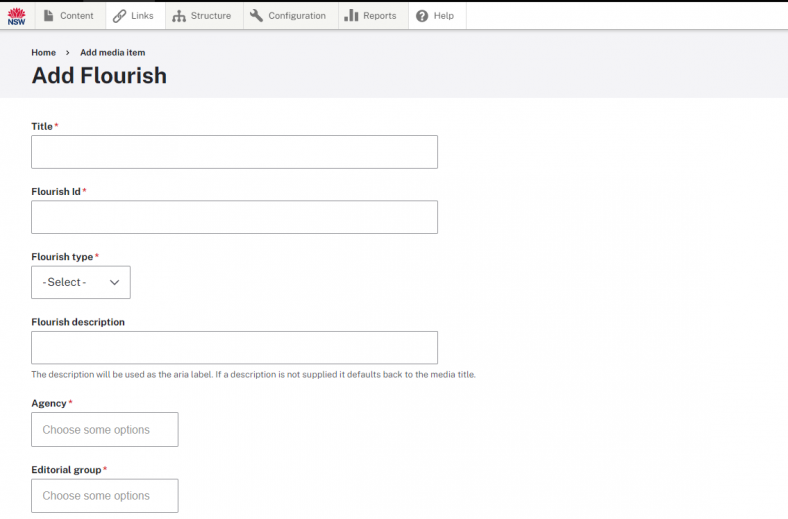
- Fill in the 4 mandatoryfields: Title, Flourish ID, Flourish type, Flourish description.
- Select 2 mandatory fields: Agency, Editorial group.
- Click Save.
Add visualisation to a page
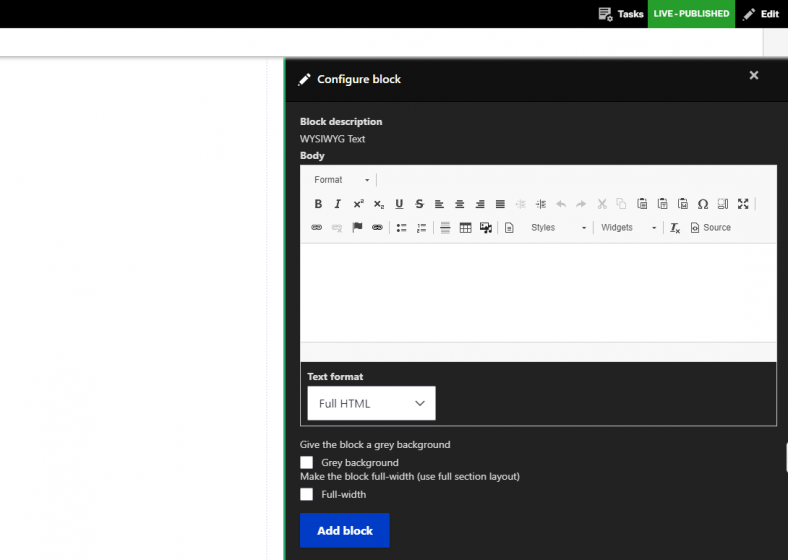
Once your data visualisation has been published and added to Drupal, you can add it to a page by following these steps:
- Click the Pre-Published/Live-Published button in the top right-hand corner
- Click the Layout button
- Click the Add block button
- Click the + Create custom block button
- Scroll down to the bottom and select the WYSIWYG Text button
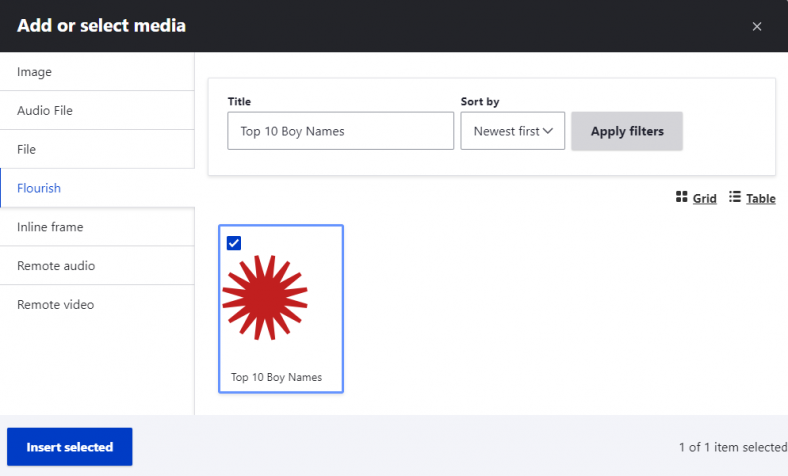
- Click the Insert from media library icon (picture and overlapping music note)
- Click the Flourish button in the left-hand margin to open search for the Flourish media files.
Live examples
You can see live examples of how agencies have created Flourish items.
Help with Flourish
Guides and online tools
Check the Flourish help guides and the Flourish YouTube channel for more information on how to use the different templates, and tips on building your visualisations.
Help Hub
If you have any questions about Flourish, contact Help Hub for assistance.