Subjective wellbeing survey
This survey measured respondents' satisfaction with a range of 'wellbeing' factors, such as our health, safety, environment and things we enjoy doing. The results will help the NSW Government identify opportunities where it can improve service delivery.
Measuring subjective wellbeing in NSW
Worldwide, the COVID-19 pandemic has sharpened the focus on people and their communities’ wellbeing and ability to withstand shocks.
Investing in people’s potential and their wellbeing is increasingly seen as essential for economic growth and building resilient communities.
The NSW Government focus on improving citizens’ wellbeing is supported by a wide range of data.
Subjective wellbeing data brings a personal perspective of what people in NSW value, and what may influence their sense of wellbeing.
What is subjective wellbeing?
Wellbeing generally refers to the quality of a person’s life, their ability to meet their potential and be able to live the kind of life they value.
While some influences on wellbeing, such as income or health status, can be observed and quantified, subjective wellbeing refers to the self-assessment made by an individual of their satisfaction with life, and aspects of their lived experience, that influence their feeling of wellbeing.
How is it measured?
The NSW Subjective Wellbeing Survey Pilot:
- focuses on 11 aspects of life (domains) that are considered to influence wellbeing
- is based on international best practice for measuring subjective wellbeing and community feedback on areas that people felt impact their wellbeing
- developed and tested an overall index that reflects change in subjective wellbeing over time, by conducting surveys (waves) at six-month intervals from 2018
- includes two dimensions to each domain, allowing people to rate both their level of satisfaction and how important each domain is to them (best-worst scaling technique).
Why measure subjective wellbeing?
The NSW Subjective Wellbeing Survey Pilot has been designed to help the NSW Government understand people’s perspective on aspects of life that influence their wellbeing.
Government agencies have a wide range of quality measures to track performance and ensure their activities are improving outcomes for the people of NSW.
Subjective wellbeing data can be used to provide additional context, adding to objective measures to create a more comprehensive picture of community wellbeing.
Evaluation of key aspects of life provide insight into changes in subjective wellbeing
Beyond material conditions, such as income, there are aspects of life that are considered highly influential on individuals’ perception of wellbeing. Increasingly, governments are considering a broad range of indicators of communities’ wellbeing.
While some surveys measure subjective wellbeing with a single item, ‘how satisfied are you with your life as a whole?’, the NSW Subjective Wellbeing Index (SWI) includes the evaluation of the eleven aspects (domains) of life listed in Table 1.
This breaks down the question of satisfaction with life into areas of personal experience or values that may contribute to overall ratings.
| Domain | What people might think of when answering questions |
|---|---|
| Standard of living | cost of living, able to afford the lifestyle that makes them happy |
| Health | general health, fitness, health conditions |
| Achievements in life | education, career, sporting, own business, travel |
| Personal relationships | family and friends, emotional relationships, accessibility. |
| Safety | feeling safe in and around their community, at work and at home |
| Feeling part of the community | engaged in their community outside their household |
| Future security | feelings about the future, next few years, financial, emotional |
| Spirituality, beliefs, religion | structured religious activities or personal beliefs |
| Amount of time you have to do the things that you like doing | spare time people have for activities they choose, fun, work-life balance |
| Quality of your local environment | natural environment where people live – the parks, public/open space |
| Daily job and/or responsibilities | How they feel about their working life, daily activities, satisfaction, opportunities |
What does the data tell us about NSW in 2021?
The NSW Subjective Wellbeing Survey Pilot commenced in April 2018 and has surveyed at least 5,000 respondents every six months.
The survey asks them to rate their satisfaction with, and relative importance of, eleven aspects (domains) of life. The SWI averages the responses to show the change in subjective wellbeing over time and relative differences between groups of people.
As a snapshot in time, the SWI reflects significant events that are personal and those that impact communities or nations. NSW has faced some significant events over the past two years, including:
- by late 2019, almost 90% of NSW was experiencing drought conditions, switching to relief in 2020
- in early 2020, the full extent of one of the worst bushfire seasons was seen across parts of the state
- the COVID-19 pandemic, with both sudden impacts on daily life and incremental change over time.
Despite these challenges, the SWI rose in early 2020 with increases in satisfaction with our health, safety, environment and time to do things we enjoy. This was a relatively large increase for a subjective wellbeing index and continued into early 2021.
This lift in overall subjective wellbeing is consistent with the similar Australian Unity Wellbeing index1 and the increase is reported across different demographic groups. It should be noted that the most recent wave (in April 2021) measured subjective wellbeing before the Delta variant forced parts of NSW into lockdown.
Older age groups continue to report higher levels of subjective wellbeing
Subjective wellbeing was consistently higher for people aged 60 and above than for other cohorts. This group shows higher levels of satisfaction than younger people in the domains relating to achievements in life, standard of living, community, time and relationships.
While working-age people and younger people have tended to have lower than average scores, there was a lift in April 2020 driven by increased satisfaction with health, safety, standard of living and environment.
Subjective wellbeing reflects a range of personal experiences within the overall increase in SWI
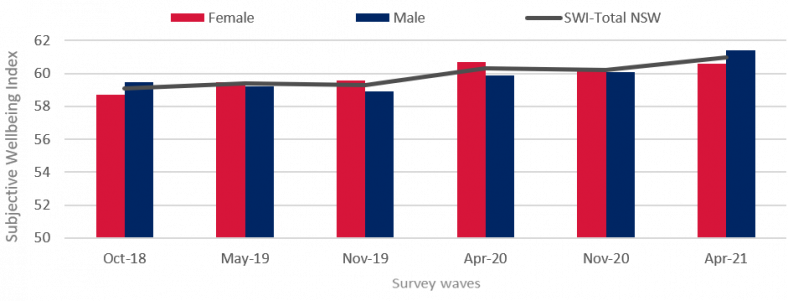
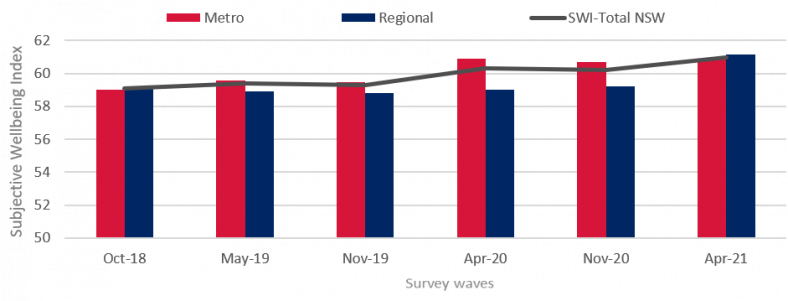
Late 2020 brought a marginal fall in the overall SWI (-0.1%), however, the SWI score for women and residents in the metropolitan areas2 rose and then fell through 2020. The SWI has steadily increased in regional NSW since early 2020, with the largest increase recorded in early 2021 (3.3%).
In April 2021, while there was variation in overall subjective wellbeing across gender and location, there were also some consistent themes influencing these cohorts, with increased satisfaction in most domains including health, community, future security, time and jobs and/or daily responsibilities and decreased satisfaction with the standard of living.
About the survey
The survey is conducted at six-month intervals, and complements existing surveys that focus on customer experience and satisfaction with government services to identify opportunities where the government can improve service delivery.
All aggregate figures presented above are the result of raw survey results statistically re-weighted by age and gender to reflect the underlying population more accurately.
The sample size for each wave of the survey has been more than 5,000 respondents, with approximately 3,000 from the Metropolitan area (includes metropolitan areas of Sydney, Newcastle and Wollongong).
Approximately 40-50% of respondents in any given wave have completed a previous wave, with around 1,000 respondents completing all waves to date.
At the aggregate NSW level, the survey has very high levels of accuracy, due to the large sample size. Typically, at the 95% confidence level, the margin of error on the SWI and the 11 wellbeing domains is approximately +/- 1% or less. For details on margins of error in the above charts see tables below.
| Wave | Gender/Location | SWI - mean | MoE +/- | MoE (%) +/- | Sample size |
|---|---|---|---|---|---|
| Oct-18 | Female | 58.71 | 0.47 | 0.79% | 3281 |
| Oct-18 | Male | 59.47 | 0.51 | 0.85% | 2714 |
| Oct-18 | Metro | 59.01 | 0.50 | 0.85% | 2775 |
| Oct-18 | Regional | 59.18 | 0.47 | 0.79% | 3232 |
| Oct-18 | Total | 59.07 | 0.34 | 0.58% | 6007 |
May-19 | Female | 59.49 | 0.44 | 0.74% | 3597 |
May-19 | Male | 59.22 | 0.55 | 0.92% | 2674 |
May-19 | Metro | 59.56 | 0.45 | 0.76% | 3704 |
May-19 | Regional | 58.88 | 0.53 | 0.90% | 2579 |
| May-19 | Total | 59.35 | 0.34 | 0.58% | 6283 |
| Nov-19 | Female | 59.61 | 0.49 | 0.82% | 3099 |
| Nov-19 | Male | 58.88 | 0.57 | 0.96% | 2505 |
| Nov-19 | Metro | 59.45 | 0.47 | 0.78% | 3532 |
| Nov-19 | Regional | 58.82 | 0.62 | 1.05% | 2078 |
| Nov-19 | Total | 59.25 | 0.37 | 0.63% | 5610 |
| Apr-20 | Female | 60.70 | 0.49 | 0.81% | 3073 |
| Apr-20 | Male | 59.88 | 0.56 | 0.94% | 2489 |
| Apr-20 | Metro | 60.86 | 0.45 | 0.75% | 3671 |
| Apr-20 | Regional | 59.04 | 0.64 | 1.08% | 1908 |
| Apr-20 | Total | 60.28 | 0.37 | 0.62% | 5579 |
| Nov-20 | Female | 60.28 | 0.50 | 0.84% | 2789 |
| Nov-20 | Male | 60.13 | 0.58 | 0.96% | 2217 |
| Nov-20 | Metro | 60.66 | 0.48 | 0.78% | 3115 |
| Nov-20 | Regional | 59.21 | 0.63 | 1.07% | 1896 |
| Nov-20 | Total | 60.20 | 0.38 | 0.63% | 5011 |
| Apr-21 | Female | 60.55 | 0.50 | 0.82% | 3181 |
| Apr-21 | Male | 61.42 | 0.51 | 0.83% | 2918 |
| Apr-21 | Metro | 60.88 | 0.42 | 0.69% | 4173 |
| Apr-21 | Regional | 61.16 | 0.66 | 1.09% | 1937 |
| Apr-21 | Total | 60.97 | 0.36 | 0.58% | 6110 |
* Ibid
For more information on the survey please reach out.
References
1 Australian Unity Wellbeing Index - Report 37 on Quality of Life, Deakin University.
2Metropolitan areas of Sydney, Newcastle and Wollongong (incl. Blue Mountains), regional refers to the rest of NSW (incl. Central Coast and Shoalhaven).
3Results from the first wave (April 2018) were significantly different from subsequent waves, due in part to a change in how the questions were asked and a significant change in sample population between the first and subsequent waves and so have been excluded from the results presented here.
4Ibid

