Download or print
Request accessible format of this publication.


Females: 39.6
Males: 37.8

Females: 43.0 per cent
Males: 57.0 per cent


Females: $1697.0
Males: $1924.8


Females: $331,657
Males: $ 416,455


Females: 30.3 hours
Males: 17.9 hours

Females: 50.3%
Males: 49.7%


Females: 6.1%
Males: 5.4%


The NSW Government closely monitors gender equality in economic outcomes. A tight labour market has created opportunities for women. However, significant disparities between men and women in both work patterns and pay remain.
The NSW labour force participation rate for females aged 15 years and over was 61.4 per cent as at July 2023, slightly lower than 61.8 per cent in July 2022 but higher than pre-pandemic levels of 60.0 per cent in February 2020.31 As at July 2023, the male participation rate was 70.4 per cent, resulting in a participation gap between men and women of 9.0 percentage points.
Job vacancies remain high compared to the start of the pandemic, reflecting strong demand for labour in most industries. As at May 2023, NSW vacancies were 61.5 per cent higher than they were in February 2020.32 An increase in employers providing flexible hours and working conditions has likely enabled more women, particularly those with caring responsibilities, to enter and stay in the labour market.33
Despite these opportunities, long-term challenges remain. Women who experience intersectional disadvantage face greater barriers to economic participation. According to the 2021 Census, the workforce participation rate for Aboriginal and Torres Strait Islander women in New South Wales was 56.0 per cent, lower than the rate of 59.1 per cent for non-Indigenous women.34 The participation rate for women who speak a language other than English at home was 55.0 per cent.35
Unemployment remains low for women in New South Wales at 3.4 per cent in July 2023. This is comparable with other state, territory and national unemployment figures.36 However, underemployment is rising and remains a persistent issue for women. Underemployment captures people who would prefer and are available to work more hours. In July 2023, the underemployment rate for women in New South Wales was 7.5 per cent compared to 5.3 per cent for men.37 Women who work part-time and are underemployed cite limited suitable hours and difficulties with childcare and family considerations as the main barriers to securing more hours, compared to men who cite lack of jobs in their line of work and lack of necessary skills as the main barriers.38
Working women in New South Wales are more than twice as likely to be in part-time work (39.6 per cent of employed women at July 2023) than working men (18.7 per cent for the same period) and are more likely to be in casual employment.39 Part-time and casual work often provide women with the flexibility required to manage care responsibilities. However, these roles can also be less secure, lower-paid, and provide fewer opportunities for career advancement.40
Chart 2.1: Full-time and part-time work by gender


The gender pay gap refers to the difference between women’s and men’s average weekly full-time earnings. It is not the difference between two people being paid differently for work of the same or comparable value.41 In New South Wales, women are paid on average 11.8 per cent less than men, or $227.80 less per week, up from 11.0 per cent in November 2022.42
This figure, however, likely understates the gender pay gap, as it is based on full-time workers and excludes overtime, bonuses, superannuation and other payments.
Across a lifetime, the gender pay gap substantially disadvantages women. Data from the Australian Taxation Office shows that, in 2020-21, men on average had a larger superannuation balance than women, and that a superannuation gap exists for all age groups above 18 years old (see Chart 2.2).43 Women in New South Wales aged 60 to 64 have on average 20.4 per cent less superannuation than men, a gap of approximately $85,000.44
Chart 2.2 Average superannuation account balances ($), 2020–21

The drivers of the gender pay gap involve the interplay of gender discrimination, caring and family responsibilities, and gender segregation within different industries and occupations.45
Across the NSW labour market, women and men have been segregated across industries, occupations and positions of leadership. It is estimated this segregation accounts for 24 per cent of Australia’s gender pay gap.46 Currently, the five highest- paid industries nationally have a higher representation of males, including mining, information media and telecommunications, and electricity, gas, water and waste services.47 In all industries, men are paid more than women on average.48
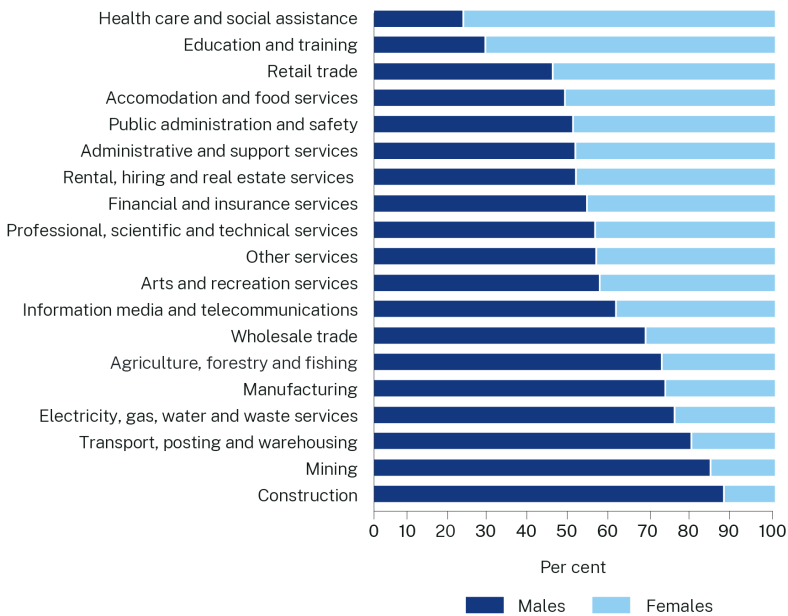
As at May 2023, the most female-dominated industries were health care and social assistance (77.9 per cent female) and education and training (72.4 per cent female), whereas the most male-dominated industries were construction (87.4 per cent male) and mining (84.1 per cent male) (see Chart 2.3).
At an occupational level, females make up 71.8 per cent of clerical and administrative workers and 68.6 per cent of community and personal service workers. Males make up 89.4 per cent of machinery operators and drivers and 83.6 per cent of technicians and trade workers.49
Chart 2.3: Gender composition of NSW industries, May 2023

This disparity in the gender composition across NSW industries has not materially improved in the past four decades. The health care, education and retail sectors have become increasingly female-dominated, which can be attributed to more women entering the labour force into these industries.50 The mining, construction and electricity sectors have made only minor gains in increasing the number of women in these industries.51
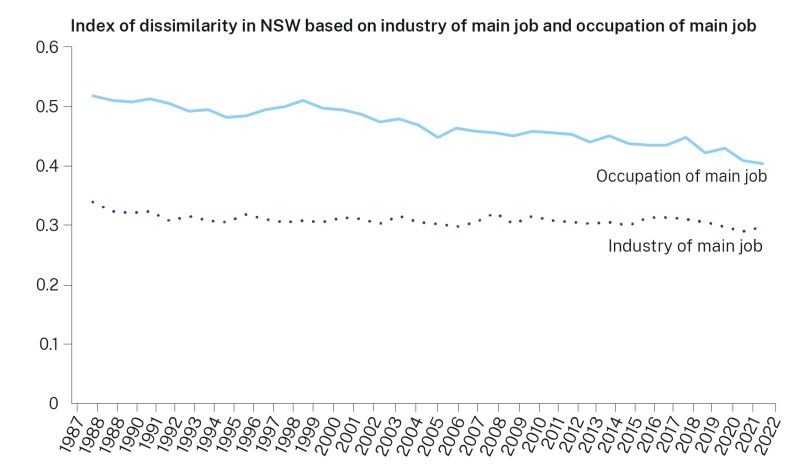
The Index of Dissimilarity is the most common measure of segregation and identifies the percentage of employed women (or men) who would have to change occupations/industries for the distribution of men and women to be equal. The dissimilarity index varies between 0 and 1, with 0 being perfectly gender-integrated and 1 being completely gender-segregated. Using this index, industry segregation has remained consistent in New South Wales, only decreasing from 0.34 in 1987 to 0.30 in 2022. Though remaining high, occupational segregation has declined across New South Wales as more women enter managerial and technical roles, from an index of dissimilarity of 0.52 in 1987 to 0.41 in 2022 (see Chart 2.4).
Chart 2.4: Index of dissimilarity in NSW based on industry and occupation of main job52

Vertical segregation (the concentration of women and men in different levels of responsibility or positions) is also prominent within occupations, with women making up only 27.4 per cent of chief executives, general managers and legislators in New South Wales.53
Women as a cohort are more likely to be negatively affected by increases to cost of living as, on average, they are paid less and have less financial security than men.
Australia’s inflation rate was 6.0 per cent over the twelve months to June 2023, down from the peak of 7.8 per cent in the December 2022 quarter.54 Sydney’s Consumer Price Index (CPI) increased 6.6 per cent for the year to June 2023.55
The cost of housing is particularly challenging. As at June 2023, according to the Sydney CPI, rents are 7.3 per cent higher than the year prior, while new dwelling prices are 9.1 per cent higher.56
Request accessible format of this publication.